The Dashboard is the first screen you see when you open Fieldfare. It's a summary of your financial position: how much you've earned, how much you've spent, and what your payment providers are costing you. All numbers are in your home currency.
Summary cards
The top of the Dashboard shows your headline numbers for the selected period: total revenue, total expenses, and net profit. These cover the current month by default.
For Priya, invoicing in USD and tracking expenses in both USD and INR, the summary shows everything converted to INR. No mental arithmetic, no spreadsheet lookups. Just the numbers that matter.

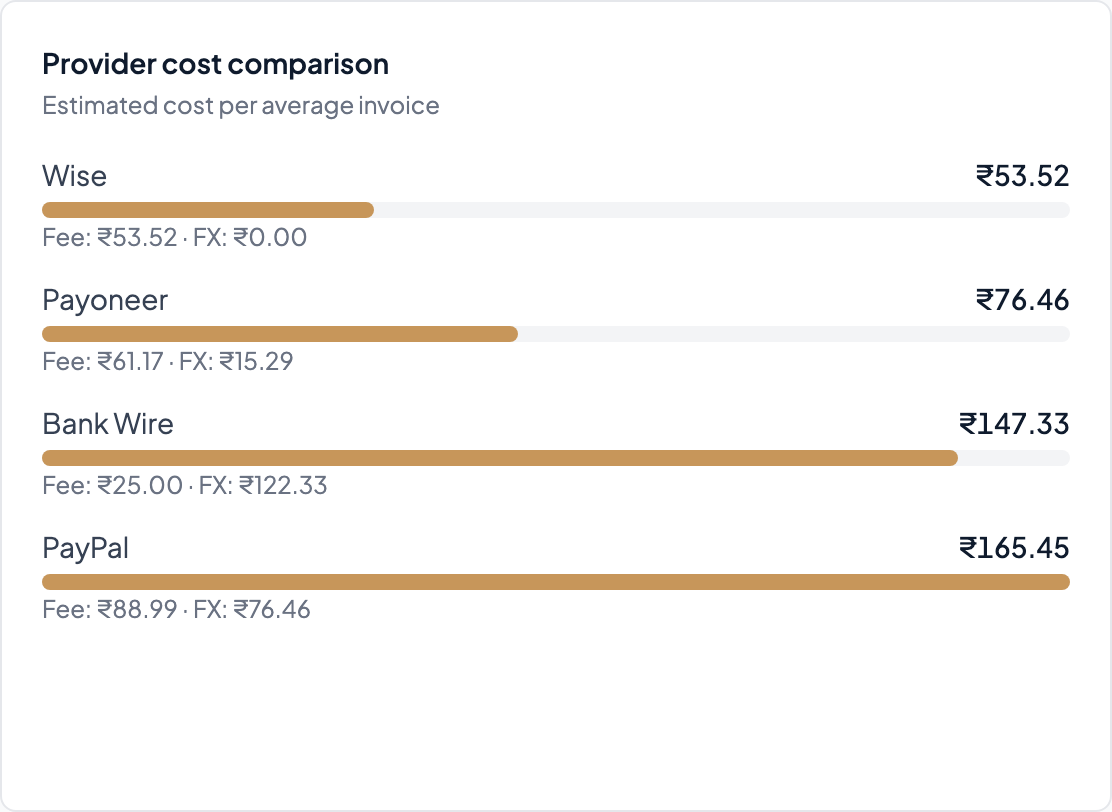
Provider comparison
Below the summary, the provider comparison widget shows how much each payment provider cost you across all payments in the period. If you're using both PayPal and Wise, this is where you see the real difference.
For many freelancers, switching from PayPal to Wise on the same volume of payments saves hundreds of dollars a year in fees and FX markup. The comparison widget makes the difference concrete: not a vague "Wise is cheaper" but actual numbers from your own payment history.
Exchange rate chart
Next to the provider comparison, Fieldfare plots the last 30 days of the exchange rate between your home currency and whichever foreign currency you invoice in most. If you invoice in more than one currency, switch between them with the dropdown.
This gives you a quick sense of where rates have moved recently — useful when deciding whether to invoice now, whether to hold off converting a payment, or just to understand why a client's payment landed heavier or lighter than you expected. Dates on the axis use your browser's locale.
Per-client breakdown
Who's your biggest client by revenue? Who pays fastest? Who costs the most in provider fees? The Dashboard breaks down your income by client so you can see where the money actually comes from, and what each client relationship costs in fees and FX.
If one client always pays through PayPal while another uses Wise, the per-client view makes the cost difference visible. Sometimes the client who pays less on paper is more profitable because they use a cheaper payment method.
Going deeper
The Dashboard gives you the headline numbers. For the full breakdown (income by client, expenses by category, FX impact line by line, and the monthly trend) go to the P&L. That's where your accountant's numbers live.